The starting point for estimating dynamic discrete choice models is John Rust’s nested fixed point algorithm. This page provides a programmatic overview of the linear model in his paper “Optimal replacement of GMC bus engines: An empirical model of Harold Zurcher,” although it can be adapted to other specifications easily enough. This page assumes that you are familiar with the technical aspects of the estimation already, and only discusses the programmatic aspects. The estimation technique has been simplified in a number of ways to ease exposition. First, I only use the contraction mapping to find the fixed point in the dynamic program (rather than Newton’s Method). Second, I use an optimization package rather than program the BHHH algorithm myself. If this means nothing to you it does not matter. The rest of the material is self contained, it just doesn’t follow Rust’s paper step by step. My primary source for this program is Rust’s original paper along with its online documentation. I also found Holger Sieg’s slides_io_ddc helpful.
The optimization package that I use is Optim. This is the only dependency that you will need to download. You can download it by removing the comment and running “Pkg.add()”. If it is already downloaded you can just run this next line.
using Optim
using ExcelReaders
It helps to start off with organized code. In Julia, you have the option to create user defined types which provide a convenient way to store variables and keep your code general. For instance, if you
Foresight helps when determining what should be in your user-defined type. Because of additive separability and conditional independence, we know that Rust’s model is completely characterized by the expected value function
![EV(o,d) = \sum_{y \in S} \log \left[ \sum_{j \in \mathbb{D}} \exp \left\lbrace u(j, y; \theta) + \beta EV(j, y) \right\rbrace \right] p(y\ |\ o,d)](https://s0.wp.com/latex.php?latex=EV%28o%2Cd%29+%3D+%5Csum_%7By+%5Cin+S%7D+%5Clog+%5Cleft%5B+%5Csum_%7Bj+%5Cin+%5Cmathbb%7BD%7D%7D+%5Cexp+%5Cleft%5Clbrace+u%28j%2C+y%3B+%5Ctheta%29+%2B+%5Cbeta+EV%28j%2C+y%29+%5Cright%5Crbrace+%5Cright%5D+p%28y%5C+%7C%5C+o%2Cd%29&bg=ffffff&fg=73757D&s=0&c=20201002)
The unknown components in this equation are 


![[0,\ 5,000] = 1](https://s0.wp.com/latex.php?latex=%5B0%2C%5C+5%2C000%5D+%3D+1&bg=ffffff&fg=73757D&s=0&c=20201002)
![(5,000,\ 10,000] = 2](https://s0.wp.com/latex.php?latex=%285%2C000%2C%5C+10%2C000%5D+%3D+2&bg=ffffff&fg=73757D&s=0&c=20201002)


With these considerations in mind, I define the type RustModel and have it store values for
type RustModel
    beta::Float64 # Discount Factor
    params::Array{Float64} # Utility Function Parameters
    pi::Array{Float64} # Transition Probabilities
    EV::Array{Float64} # Expected Value Array
    K::Int32 # Size of State Space

   # Initialize Model Parameters
    function RustModel( beta = .9999, K = 90 )
       EV = ones(K, 1)
       pi = [.348, .639, .013]
       params = [3.6, 10]
       return new( beta, params, pi, EV, K )
    end
end;

m = RustModel()

println("Beta is ", m.beta)
println("Guesses for theta are ", m.params)
println("Transition probability guesses are ", m.pi)
println("Size of State Space: ", m.K)
Beta is 0.9999
Guesses for theta are [3.6, 10.0]
Transition probability guesses are [0.348, 0.639, 0.013]
Size of State Space: 90
I similarly define a type for the data. The two variables will be the endogenous decision variable and the exogenous state variable
type RustData
    endog::Array{Int32}
    exog::Array{Int32}

    function RustData( endog = [], exog = [])
        return new( endog, exog )
    end
end
Per Period Returns Function
The return function is given by the following discrete linear form

and

where 


The function 
function u(model::RustModel)
    S = collect(1:model.K)' # Generate State Space range, i.e. [1, 2, 3, 4, ...]
    d_0 = .001 * model.params[1] * S # Utility from not replacing
    d_1 = model.params[2] * ones(1, model.K) # Utility from replacing
    U = vcat(d_0, d_1) # Utility matrix
    return -U
end

u(m)
2×90 Array{Float64,2}:
  -0.0036   -0.0072   -0.0108   -0.0144  …   -0.3168   -0.3204   -0.324
 -10.0     -10.0     -10.0     -10.0        -10.0     -10.0     -10.0
Transition Probabilities
The transition matrix is assumed to have a simple form. Given any state today, the probability of staying in that state is 


Note that we can (and do) estimate 


The function transition_probs takes a RustModel variable and returns a 
function transition_probs(model::RustModel)
    t = length(model.pi)
    ttmp = zeros(model.K - t, model.K) # Transition Probabilities
    for i in 1:model.K - t
        for j in 0:t-1
            ttmp[i, i + j] = m.pi[j+1]
        end
    end
    atmp = zeros(t,t) # Absorbing State Probabilities
    for i in 0:t - 1
        atmp[i+ 1,:] = [zeros(1,i) m.pi[1:t - i - 1]' ( 1 - sum(m.pi[1:t- i - 1]) ) ]
    end
    return [ttmp ; zeros(t, model.K - t) atmp]
end;

transition_probs( m )
90×90 Array{Float64,2}:
 0.348  0.639  0.013  0.0    0.0    …  0.0    0.0    0.0    0.0    0.0
 0.0    0.348  0.639  0.013  0.0       0.0    0.0    0.0    0.0    0.0
 0.0    0.0    0.348  0.639  0.013     0.0    0.0    0.0    0.0    0.0
 0.0    0.0    0.0    0.348  0.639     0.0    0.0    0.0    0.0    0.0
 0.0    0.0    0.0    0.0    0.348     0.0    0.0    0.0    0.0    0.0
 0.0    0.0    0.0    0.0    0.0    …  0.0    0.0    0.0    0.0    0.0
 0.0    0.0    0.0    0.0    0.0       0.0    0.0    0.0    0.0    0.0
 0.0    0.0    0.0    0.0    0.0       0.0    0.0    0.0    0.0    0.0
 0.0    0.0    0.0    0.0    0.0       0.0    0.0    0.0    0.0    0.0
 0.0    0.0    0.0    0.0    0.0       0.0    0.0    0.0    0.0    0.0
 0.0    0.0    0.0    0.0    0.0    …  0.0    0.0    0.0    0.0    0.0
 0.0    0.0    0.0    0.0    0.0       0.0    0.0    0.0    0.0    0.0
 0.0    0.0    0.0    0.0    0.0       0.0    0.0    0.0    0.0    0.0
 ⋮                                  ⋱  ⋮
 0.0    0.0    0.0    0.0    0.0       0.0    0.0    0.0    0.0    0.0
 0.0    0.0    0.0    0.0    0.0       0.0    0.0    0.0    0.0    0.0
 0.0    0.0    0.0    0.0    0.0    …  0.0    0.0    0.0    0.0    0.0
 0.0    0.0    0.0    0.0    0.0       0.0    0.0    0.0    0.0    0.0
 0.0    0.0    0.0    0.0    0.0       0.0    0.0    0.0    0.0    0.0
 0.0    0.0    0.0    0.0    0.0       0.013  0.0    0.0    0.0    0.0
 0.0    0.0    0.0    0.0    0.0       0.639  0.013  0.0    0.0    0.0
 0.0    0.0    0.0    0.0    0.0    …  0.348  0.639  0.013  0.0    0.0
 0.0    0.0    0.0    0.0    0.0       0.0    0.348  0.639  0.013  0.0
 0.0    0.0    0.0    0.0    0.0       0.0    0.0    0.348  0.639  0.013
 0.0    0.0    0.0    0.0    0.0       0.0    0.0    0.0    0.348  0.652
 0.0    0.0    0.0    0.0    0.0       0.0    0.0    0.0    0.0    1.0
Social Surplus Function
Remember that the expected value function takes the form

where 
![G(o_t) = \log \left\lbrace \sum_{j \in \mathbb{D}} \exp \left[u(j, o_t) + \beta EV(j, o_t) \right] \right\rbrace](https://s0.wp.com/latex.php?latex=G%28o_t%29+%3D+%5Clog+%5Cleft%5Clbrace+%5Csum_%7Bj+%5Cin+%5Cmathbb%7BD%7D%7D+%5Cexp+%5Cleft%5Bu%28j%2C+o_t%29+%2B+%5Cbeta+EV%28j%2C+o_t%29+%5Cright%5D+%5Cright%5Crbrace&bg=ffffff&fg=73757D&s=0&c=20201002)
Note that 

The program ss takes a RustModel variable and returns a 


function ss(model::RustModel)
    ss_val = (  exp( u( model )[1,:] + model.beta * model.EV - model.EV) +
                exp( u( model )[2,:] + model.beta * model.EV[1] - model.EV) )
    return model.EV + log( ss_val )
end;
Contraction Mapping
With the social surplus vector (i.e. the vector of the functions values for each state) and the transition probabilities we can construct the expected value vector

The contraction mapping uses an initial guess for 


This function takes a RustModel variable and doesn’t return anything. It merely updates the value of
function contraction_mapping( model::RustModel )
    P = sparse( transition_probs( model ) ) # Transition Matrix (K x K)
    eps = 1 # Set epsilon to something greater than 0
    while eps > .000001
        EV1 = P * ss( model )
        eps = maximum(abs(EV1 - model.EV))
        model.EV = EV1
    end
end;

m.EV = ones(1, m.K)'
contraction_mapping( m )
println(m.EV)
[-1718.29; -1718.54; -1718.78; -1719.02; -1719.25; -1719.48; -1719.71; -1719.92; -1720.14; -1720.34; -1720.54; -1720.74; -1720.93; -1721.12; -1721.3; -1721.47; -1721.65; -1721.81; -1721.97; -1722.13; -1722.28; -1722.42; -1722.57; -1722.7; -1722.84; -1722.96; -1723.09; -1723.21; -1723.32; -1723.43; -1723.54; -1723.64; -1723.74; -1723.84; -1723.93; -1724.02; -1724.11; -1724.19; -1724.27; -1724.35; -1724.42; -1724.49; -1724.56; -1724.63; -1724.69; -1724.76; -1724.82; -1724.87; -1724.93; -1724.98; -1725.04; -1725.09; -1725.14; -1725.18; -1725.23; -1725.27; -1725.32; -1725.36; -1725.4; -1725.44; -1725.47; -1725.51; -1725.55; -1725.58; -1725.62; -1725.65; -1725.68; -1725.71; -1725.74; -1725.77; -1725.8; -1725.83; -1725.85; -1725.88; -1725.91; -1725.93; -1725.95; -1725.98; -1726.0; -1726.02; -1726.04; -1726.06; -1726.08; -1726.1; -1726.11; -1726.13; -1726.14; -1726.15; -1726.15; -1726.15]
Choice Probabilities
Choice probabilities can be derived from the social surplus function. The expression for these probabilities is
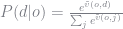
where 
The following function returns a choice probability vector of the form
![P_k = [\ P(0\ |\ 0),\ P(0\ |\ 1),\ P(0\ |\ 2), ...,\ P(0\ |\ K)\ ]](https://s0.wp.com/latex.php?latex=P_k+%3D+%5B%5C+P%280%5C+%7C%5C+0%29%2C%5C+P%280%5C+%7C%5C+1%29%2C%5C+P%280%5C+%7C%5C+2%29%2C+...%2C%5C+P%280%5C+%7C%5C+K%29%5C+%5D+&bg=ffffff&fg=73757D&s=0&c=20201002)
Again, overflow is an issue, so the maximum value of
function choice_p( model::RustModel )
    max_EV = maximum( model.EV )
    P_k = exp( u( model )[1,:] + model.beta *  model.EV - max_EV ) ./
    ( exp( u( model )[1, :] + model.beta *  model.EV - max_EV ) + exp( u( model )[2,:] + model.beta *  model.EV[1] - max_EV ) )
    return P_k
end;
Partial Log-Likelihood
The likelihood function, given the choice probabilities and the transition probabilities, is given by

A simpler formulation, which still provides consistent estimates, is the partial log-likelihood function

First we need to limit the data to the relevant probabilities given the current state. After taking the log of these probabilities, we then need to select the log-probability of the agent’s choice and sum over these. This will be the log-likelihood.
function partialLL( model::RustModel, data::RustData)
    decision_obs = data.endog
    state_obs = data.exog
    cp_tmp = choice_p( model )
    relevant_probs = [ cp_tmp[convert(Int, i)] for i in state_obs ]
    pll = [ if decision == 0 log(r_p) else log(1 - r_p) end for (decision, r_p) in zip(decision_obs, relevant_probs)]
    return -sum(pll)
end

function ll( model::RustModel, data::RustData )

    function objFunc( params )
        model.params = params
        contraction_mapping( model )
        pll = partialLL( model, data )
        return pll
    end

    params0 = [.01, 4]
    optimum = optimize( objFunc, params0 )
    return optimum
end
John Rust’s Bus Engine Replacement Data
This section just runs code to clean Rust’s original datasets. It can largely be ignored. Just note that the omax and n variables below need to match your choice of K in the RustModel type. The data has been compiled from files that can be found on the companion website to Aguirregabiria and Mira’s paper “Dynamic discrete choice structural models: A survey” (see here).
using DataFrames
d309 = readxlsheet(DataFrame, "[path]/Datasets/NFXP.xlsx", "d309", header = false);
g870 = readxlsheet(DataFrame, "[path]/Datasets/NFXP.xlsx", "g870", header = false);
rt50 = readxlsheet(DataFrame, "[path]/Datasets/NFXP.xlsx", "rt50", header = false);
t8h203 = readxlsheet(DataFrame, "[path]/Datasets/NFXP.xlsx", "t8h203", header = false);
a452372 = readxlsheet(DataFrame, "[path]/Datasets/NFXP.xlsx", "a452372", header = false);
a452374 = readxlsheet(DataFrame, "[path]/Datasets/NFXP.xlsx", "a452374", header = false);
a530872 = readxlsheet(DataFrame, "[path]/Datasets/NFXP.xlsx", "a530872", header = false);
a530874 = readxlsheet(DataFrame, "[path]/Datasets/NFXP.xlsx", "a530874", header = false);
a530875 = readxlsheet(DataFrame, "[path]/Datasets/NFXP.xlsx", "a530875", header = false);
Each column of the matrix corresponds to an individual bus. The first 11 rows correspond to header information. Respectively,
1. Bus Number
2. Month Purchased
3. Year Purchased
4. Month of 1st Engine Replacement
5. Year of  1st Engine Replacement
6. Odometer at Replacement
7. Month of 2nd Engine Replacement
8. Year of  2nd Engine Replacement
9. Odometer at Replacement
10. Month Odometer Data Begins
11. Year Odometer Data Begins
# Reshape to Proper Matrix Format
d309 = reshape(d309[1], 110, 4);
g870 = reshape(g870[1], 36, 15);
rt50 = reshape(rt50[1], 60, 4);
t8h203 = reshape(t8h203[1], 81, 48);
a452372 = reshape(a452372[1], 137, 18);
a452374 = reshape(a452374[1], 137, 10);
a530872 = reshape(a530872[1], 137, 18);
a530874 = reshape(a530874[1], 137, 12);
a530875 = reshape(a530875[1], 128, 37);

n = 90; # Fixed point dimension
omax = 450000; # Upper bound on the odometer reading

rt=zeros(n,1);
nt=copy(rt);
rc=copy(rt);
nc=copy(rt);

milecnt=zeros(n,1);

function build(input)
    dt = copy(input)
    # Get odometer values at replacement
    ov1=dt[6,:]'
    ov2=dt[9,:]'

    # Get dimensions of the underlying data
    nr = size(dt, 1);
    nc = size(dt, 2);
    #
    dtc= (dt[12:nr,:] .>= ov1) .* (ov1 .> 0) + (dt[12:nr,:] .>= ov2) .* (ov2 .> 0);
    dtx = dt[12:nr,:] + ov1 .* dtc .* (dtc-2) - .5*ov2.*dtc.*(dtc-1);
    dtx = ceil(n*dtx/omax);
    #
    dtc=vcat((dtc[2:nr-11,:]-dtc[1:nr-12,:]), zeros(1, nc));
    mil=(dtx[2:nr-11,:]-dtx[1:nr-12,:]) + dtx[1:nr-12,:].*dtc[1:nr-12,:];
    df = DataFrame(dtc = copy(vec(dtc[2:nr-11,:])), dtx = copy(vec(dtx[2:nr-11,:])), mil = copy(vec(mil[:,:])));
    return df
end

inputDataset = build(g870);
for i in [rt50, t8h203, a530875 ]
    inputDataset = vcat(inputDataset, build(i))
end
Estimating the Rust Model
m = RustModel()

rd = RustData()
rd.endog = inputDataset[1]
rd.exog = inputDataset[2]

pi_1 = sum( [x == 0 for x in inputDataset[3] ] )/length(inputDataset[3])
pi_2 = sum( [x == 1 for x in inputDataset[3] ] )/length(inputDataset[3])
pi_3 = 1 - pi_1 - pi_2

m.pi = [ pi_1, pi_2, pi_3 ]

@time ll( m, rd )
218.624701 seconds (2.45 G allocations: 217.564 GB, 8.66% gc time)

Results of Optimization Algorithm
 * Algorithm: Nelder-Mead
 * Starting Point: [0.01,4.0]
 * Minimizer: [2.6274875140792378,9.758217072326453]
 * Minimum: 3.002501e+02
 * Iterations: 1000
 * Convergence: false
   *  √(Σ(yᵢ-ȳ)²)/n < 1.0e-08: false
   * Reached Maximum Number of Iterations: true
 * Objective Function Calls: 1017
Calculating Standard Errors
The derivation of the standard errors depends on your choice of
![I(\theta) = - \mathbb{E} \left[ \frac{\partial^2 \ln L(\theta)}{\partial \theta \partial \theta^{\prime}}\right]](https://s0.wp.com/latex.php?latex=I%28%5Ctheta%29+%3D+-+%5Cmathbb%7BE%7D+%5Cleft%5B+%5Cfrac%7B%5Cpartial%5E2+%5Cln+L%28%5Ctheta%29%7D%7B%5Cpartial+%5Ctheta+%5Cpartial+%5Ctheta%5E%7B%5Cprime%7D%7D%5Cright%5D&bg=ffffff&fg=73757D&s=0&c=20201002)
We must therefore compute this matrix in order to get our standard errors. Actually, we can make a simplification by noting that the information identity requires the covariance of the scores is equal to the negative of the Hessian at the true parameter values (see Train 2009 for a derivation of this property). The observations score is the derivative of the log choice probability and given our functional form above, it is straightforward to see that

(remember that 


In our case the operator is 


where 


![T(EV) = \left[\begin{matrix}\pi_0 & \pi_1 & \pi_2 & 0 & 0 & \cdots & 0 & 0\\0 & \pi_0 & \pi_1 & \pi_2 & 0 & \cdots & 0 & 0\\\vdots & & & & \ddots & & & \vdots\\0 & 0 & 0 & 0 & 0 & \cdots & \pi_0 & 1 - \pi_0 \\0 & 0 & 0 & 0 & 0 & \cdots & 0 & 1 \\\end{matrix}\right]\left[\begin{matrix}\ln\left\lbrace \exp\left(u(0,d) + \beta EV(0)\right) + \exp\left(u(0,d) + \beta EV(0)\right) \right\rbrace\\\ln\left\lbrace \exp\left(u(1,d) + \beta EV(1)\right) + \exp\left(u(1,d) + \beta EV(0)\right) \right\rbrace\\\vdots\\\ln\left\lbrace \exp\left(u(K,d) + \beta EV(K)\right) + \exp\left(u(K,d) + \beta EV(0)\right) \right\rbrace\\\end{matrix}\right]](https://s0.wp.com/latex.php?latex=T%28EV%29+%3D+%5Cleft%5B%5Cbegin%7Bmatrix%7D%5Cpi_0+%26+%5Cpi_1+%26+%5Cpi_2+%26+0+%26+0+%26+%5Ccdots+%26+0+%26+0%5C%5C0+%26+%5Cpi_0+%26+%5Cpi_1+%26+%5Cpi_2+%26+0+%26+%5Ccdots+%26+0+%26+0%5C%5C%5Cvdots+%26+%26+%26+%26+%5Cddots+%26+%26+%26+%5Cvdots%5C%5C0+%26+0+%26+0+%26+0+%26+0+%26+%5Ccdots+%26+%5Cpi_0+%26+1+-+%5Cpi_0+%5C%5C0+%26+0+%26+0+%26+0+%26+0+%26+%5Ccdots+%26+0+%26+1+%5C%5C%5Cend%7Bmatrix%7D%5Cright%5D%5Cleft%5B%5Cbegin%7Bmatrix%7D%5Cln%5Cleft%5Clbrace+%5Cexp%5Cleft%28u%280%2Cd%29+%2B+%5Cbeta+EV%280%29%5Cright%29+%2B+%5Cexp%5Cleft%28u%280%2Cd%29+%2B+%5Cbeta+EV%280%29%5Cright%29+%5Cright%5Crbrace%5C%5C%5Cln%5Cleft%5Clbrace+%5Cexp%5Cleft%28u%281%2Cd%29+%2B+%5Cbeta+EV%281%29%5Cright%29+%2B+%5Cexp%5Cleft%28u%281%2Cd%29+%2B+%5Cbeta+EV%280%29%5Cright%29+%5Cright%5Crbrace%5C%5C%5Cvdots%5C%5C%5Cln%5Cleft%5Clbrace+%5Cexp%5Cleft%28u%28K%2Cd%29+%2B+%5Cbeta+EV%28K%29%5Cright%29+%2B+%5Cexp%5Cleft%28u%28K%2Cd%29+%2B+%5Cbeta+EV%280%29%5Cright%29+%5Cright%5Crbrace%5C%5C%5Cend%7Bmatrix%7D%5Cright%5D&bg=ffffff&fg=73757D&s=0&c=20201002)
Let 

![T^{\prime}(EV) = \beta \cdot \left[\begin{matrix}\pi_0 p_{10} + \pi_1 p_{11} + \pi_2 p_{12} & \pi_1 p_{01} & \pi_2 p_{02} & 0 & 0 & \cdots & 0 & 0\\\pi_0 p_{11} + \pi_1 p_{12} + \pi_2 p_{13} & \pi_0 p_{01} & \pi_1 p_{02} & \pi_2 p_{03} & 0 & \cdots & 0 & 0\\\vdots & & & & \ddots & & & \vdots\\p_{1K} & 0 & 0 & 0 & 0 & \cdots & 0 & p_{0K}\\\end{matrix}\right]](https://s0.wp.com/latex.php?latex=T%5E%7B%5Cprime%7D%28EV%29+%3D+%5Cbeta+%5Ccdot+%5Cleft%5B%5Cbegin%7Bmatrix%7D%5Cpi_0+p_%7B10%7D+%2B+%5Cpi_1+p_%7B11%7D+%2B+%5Cpi_2+p_%7B12%7D+%26+%5Cpi_1+p_%7B01%7D+%26+%5Cpi_2+p_%7B02%7D+%26+0+%26+0+%26+%5Ccdots+%26+0+%26+0%5C%5C%5Cpi_0+p_%7B11%7D+%2B+%5Cpi_1+p_%7B12%7D+%2B+%5Cpi_2+p_%7B13%7D+%26+%5Cpi_0+p_%7B01%7D+%26+%5Cpi_1+p_%7B02%7D+%26+%5Cpi_2+p_%7B03%7D+%26+0+%26+%5Ccdots+%26+0+%26+0%5C%5C%5Cvdots+%26+%26+%26+%26+%5Cddots+%26+%26+%26+%5Cvdots%5C%5Cp_%7B1K%7D+%26+0+%26+0+%26+0+%26+0+%26+%5Ccdots+%26+0+%26+p_%7B0K%7D%5C%5C%5Cend%7Bmatrix%7D%5Cright%5D&bg=ffffff&fg=73757D&s=0&c=20201002)
If you stare at the above matrix you will notice that the rows sum to 
The final piece we need is 


Combining these expressions into a single matrix we can calculate the score for each observation and calculate their covariance to estimate the negative Hessian. The square-root of the diagonal elements of the inverse of the Hessian are our standard errors.
m.params = ot.minimizer
tmpP = choice_p(m)
byOb = tmpP[rd.exog,:]

T = length(rd.exog)

tmpT2 = transition_probs(m)[:,2:end] .* tmpP[2:end,:]'

dR = -(1-transition_probs(m) * tmpP)
dTheta = -(transition_probs(m)*(1:1:90)*-.001) .* tmpP

dEV = inv(eye(m.K) - m.beta * hcat(1 - sum(tmpT2,2), tmpT2)) * hcat(dTheta, dR)

# Derivative of utility with respect to parameters
tmp = -(1 - byOb .* (rd.endog .== 0) .- (1-byOb) .* (rd.endog .== 1))
score = hcat( -.001*rd.exog, -ones(T, 1)).*tmp

# Add the derivative of the difference in Expected Value
score .+= m.beta*(dEV[1,:]' .* ones(T,1) .- dEV[rd.exog, :]) .*tmp

# Calculate inverse of the covariance
H = inv(score'score)
se = sqrt(diag(H))

hcat( ot.minimizer, se)
2×2 Array{Float64,2}:
 2.62749  0.616073
 9.75822  1.22672

When replacement is chosen, why do you take only the first element of EV (EV[1])?
LikeLike
When the agent chooses to replace the engine, the state is reset to 0 and the expected value of being in state 0 is given by the first element of EV. So the agent is chooses between two values when in state x: u(0,x) + beta*EV(0, x) (the value of not replacing), and u(1,0) + beta*EV(1,0) (the value of replacing). Because EV(1,x) = EV(0, 0), we can represent EV by a single vector (rather than a vector for each choice), and just use the first value of EV whenever the decision to replace is made.
LikeLike
Thank you very much
LikeLike
Can I make you another question? In order to sample the first state, we usually use a stationary distribution, to which we arrive through the transition probabilities. However, in this case, the stationary probabilities are just (0, 0, …, 0, 1). So, when you simulate, do you just assume that the realized states start from x0?
LikeLike
I think it makes more sense to start from the stationary distribution of the controlled process. The stationary probabilities are (0,0,…,1) because engine mileage always increases for the uncontrolled process, and so the stationary distribution will put all the mass on the upper bound. But if you consider the transitions of the controlled process, the process is almost never at the upper bound. For instance
# Choice probabilities
cp = 1 – choice_p(m);
# Controlled system transition matrix
Π = transition_probs( m ) .* (1-pps) + hcat(ones(500,1), zeros(500, 499)) .* pps;
# Stationary Distribution
statdst = inv((eye(m.K) – Π + ones(m.K,m.K))’)*ones(m.K)
The expected state of this system is ~ 121. However, for many of my applications, I simulate from the last observed state because I am studying how the state evolves from that point. So where I start the simulation typically depends on the problem I’m studying. Hope this answers your questions.
LikeLike
Thank you very much, Mark. I assume that, by pps, you mean cp, and that hcat(ones(500,1), zeros(500, 499)) should be hcat(ones(90,1), zeros(90, 89)), right?
LikeLike
Yep, sorry about that. It should be:
Π = transition_probs( m ) .* (1-cp) + hcat(ones(m.K), zeros(m.K, m.K-1)) .* cp;
Thanks for catching that.
LikeLike
Dear Mark,
hi again. In line 10 of your last code chunk, you have an element-by-element product by the choice probabilities, as Rust does in his manual. Why isn’t it -0.001*transition_probs(m)*(tmpP.*(1:1:90))? This which would result in a vector with the following lines:
p(0|x1)*x1*f(x1|x1,0) + p(0|x2)*x2*f(x2|x1,0) + p(0|x3)*x3*f(x3|x1,0)
p(0|x2)*x2*f(x2|x2,0) + p(0|x3)*x3*f(x3|x2,0) + p(0|x4)*x4*f(x4|x2,0)
.
.
.
Instead, in your and Rust’s code, the vector is
p(0|x1) * [ x1*f(x1|x1,0) + x2*f(x2|x1,0) + x3*f(x3|x1,0) ]
p(0|x2)* [ x2*f(x2|x2,0) + x3*f(x3|x2,0) + x4*f(x4|x2,0) ]
.
.
.
In line 9, I agree with dR, where you have a linear combination of the columns of the transition matrix weighted by the choice probabilities.
Thank you,
Eliza
LikeLike
The code (or the equations) could be wrong. It’s been awhile since I looked at it. Have you tried taking the numerical derivative of the contraction mapping and comparing that result to the analytic derivative? That would be an easy way to check which is correct.
LikeLike
Hello –
Is the code associated with this post available as a direct download somewhere?
Thanks for putting this together.
Matt
LikeLike
Dear Mark.
Thank you for your code sharing.
Except for some minor changes in julia syntax (mostly on elementwise calculation in array), it worked quite well in general.
However, the last section on standard errors is problematic for me.
First, in line 18 for the section, doesn’t one need to multiply *m.beta* given form of v=u+\beta*EV?
Second, I ran the code with just simple changes for elementwise syntax, but it returns much smaller standard errors compared to the original: (0.0121674,0.187222). I have tackled this for a while, however cannot find why such huge differences are made.
LikeLike
Thanks for catching this. Unfortunately, most of the code was written under Julia 0.6, so a lot of the syntax needs to be updated to be compatible with Julia 1.0. I updated the code block for three mistakes. First, in line 16, I wasn’t multiplying the score by (1 – P(d|x)). Second, the derivatives for theta and RC were switching in line 16. Finally, I added in m.beta following your suggestion. Once I made these adjustments I get the correct standard errors. I really appreciate the feedback. Let me know if you find anything else.
LikeLike
Could I ask what does &gt mean in John Rust’s Bus Engine Replacement Data section?
LikeLike
Looks like the webpage converted the “greater than” sign to that string of text. Should be fixed now. Thanks for the heads up.
LikeLike
Thanks for the great code and explanations! In the last section where the standard errors are calculated I was wondering why tmpP is not a (K times 1)-vector but seems to have a higher dimension in the second component, as you write tmpP[2:end,:] instead of tmpP[2:end]
LikeLike
I’m fairly sure that it is Kx1 and Julia is just letting me get away with sloppy coding. The transition probabilities are in a matrix, so that elementwise multiplication wouldn’t make much sense if tmpP was multi-dimensional. When I have time I will check it and update as necessary. Thanks for pointing this out.
LikeLike